GHG Management
Our Decarbonization Strategies
In order to decarbonize carbon footprint in our operations and value chain, we are exploring a diversified portfolio of solutions including new ideas and working with others to drive innovation. Indorama Ventures is exploring a combination of following decarbonization strategies:
Improving operational efficiency

Invest in operational and energy efficiency to reduce emissions in our operations
Renewable Electricity

Recycling

Circular Feedstock (Bio-based and Recycled feedstocks)

Replacing fossil fuel-based feedstocks with bio-based and recycled feedstocks
Future Technologies

Exploring opportunities for Carbon Capture Utilization and Storage (CCUS), green hydrogen, bio/renewable feedstock, Renewable Natural Gas (RNG)
Natural Capital Solutions

Explore partial/full ownership of carbon offsetting projects
Direct GHG Emissions - Scope 1
Indirect GHG Emissions - Scope 2
Location-based
Market-based
Total GHG Emissions-Scope 1 & 2
Location-based
Market-based
Emissions linked to energy consumption
| 2021 | 2022 | 2023 | 2024 | |
|---|---|---|---|---|
| Direct Greenhouse gas (GHG) emissions (kt CO2e) | 7,207 | 7,195 | 7,103 | 6,970 |
| Indirect Greenhouse gas (GHG) emissions (kt CO2e) | 2,619 | 2,535 | 2,376 | 2,600 |
| Total Greenhouse gas (GHG) emissions (kt CO2e) | 9,826 | 9,720 | 9,479 | 9,570 |
Note:
- Intensities are calculated based on overall production including inter-company sales.
- 2020 and 2021 environmental data has been restated using a more stringent definition and methodology.
- 2020 baseline was adjusted for an alignment.
Indorama Ventures calculated direct and indirect emissions (GHG Scope 1 and 2) for all of its operations globally in accordance with the GHG Accounting Protocols-Greenhouse Gas Protocol on Corporate Accounting and Reporting by the World Resource Institute (WRI)/World Business Council for Sustainable Development (WBCSD) and ISO 14064-1:2006.
100% GHG Disclosure
Since 2013, we have reported on 100% our GHG emissions from all of our sites worldwide. This includes GHG accounting of Scope 1 and 2 emissions from direct and indirect emissions sources. We also established criteria to calculate Scope 3 emissions emitted from our supply chain globally, along with a few major categories applicable to Indorama Ventures. Furthermore, we plan on having an annual verification process going forward carried out by a third party to ensure the transparency, consistency and accuracy of all GHG data disclosed, in accordance with ISO 14064-1 and 14064-3 requirements.
GHG Emissions Strategy
We realize that fossil fuels are the main contributor to our GHG emissions. To achieve a reduction and improve our operational efficiency, we are exploring ways to acquire increased renewable electricity from producers who operate solar, wind, or facilities from other renewable sources. We are exploring the benefits of joining national associations of renewable electricity buyers in order to gain greater negotiating power and a fair electricity price, as well as the option of renewable energy procurement through a global virtual PPA in-line with the Paris protocol to further reduce our GHG emissions.
GHG verification and assurance
Our audited GHG Scope 1, Scope 2 and Scope 3 Emissions
| Emissions Source | Amount (tCO2e) |
| A - Greenhouse Gas Inventory | |
| Scope 1 | 6,121,316 |
| Scope 2 (Location-based) | 2,545,481 |
| Scope 1 and Scope 2 (Location-based) | 8,666,797 |
| Scope 1 and Scope 2 emission intensity (Location-based) | 0.5716 tCO₂e / ton of production |
| Scope 2 (Market-based) | 2,470,747 |
| Scope 1 and Scope 2 (Market-based) | 8,592,063 |
| Scope 1 and Scope 2 emission intensity (Market-based) | 0.5666 tCO₂e / ton of production |
| Biogenic emissions | 68,474 |
We are actively pursuing innovative opportunities with our technical partners to invest in projects aimed at capturing and utilizing CO2. Among the notable initiatives is our collaboration at the Indorama Ventures Polymers Mexico site, where we are currently exploring the capture of CO2 from heaters, with the potential to mitigate emissions by 29,000 tCO2e. Additionally, we are investigating carbon capture at our Port Neches site, with the potential to mitigate up to 650,000 tCO2e annually
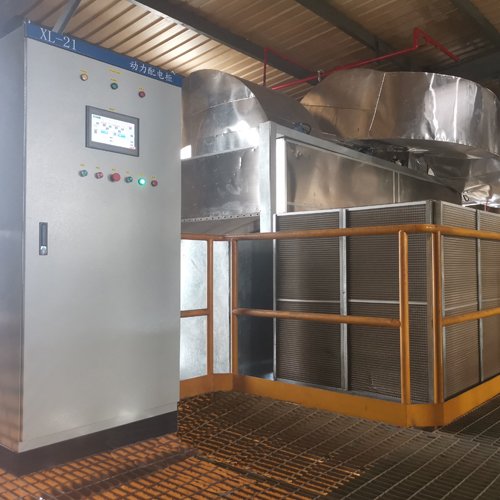
As part of Indorama Ventures’ commitment to decarbonization, Indorama Ventures Mobility Bohemia s.r.o. implemented a new condensate system in the spinning hall in 2024 to reduce steam consumption and enhance operational efficiency. By installing heat recovery equipment and optimizing the condensate return process, the project achieved a GHG reduction of 3,188 tCO₂e per year, steam savings of 31,875 GJ per year, and significant cost savings of $ 632,440 annually. This initiative demonstrates meaningful progress in climate action and operational excellence, reinforcing the company’s broader sustainability goals.
In 2023, IVL Dhunseri Petrochem Industries Private Limited in India successfully converted a hot oil coal heater to natural gas, resulting in an estimated GHG savings of 35,000 tCO2e annually, a significant step towards achieving 100% coal phase-out by 2030. Coupled with the reduction of 264,000 tCO2e from 2020 to 2023, equivalent to 3.8% of our Scope 1 baseline emissions, achieved through decreased coal usage, our journey to phase out coal from operations is underway. Initiatives like switching to biomass have rendered the heater area dust-free, making maintenance easier and safer, thereby reducing the need for casual deployment and enabling their utilization for other tasks. This transition has not only enhanced safety but also contributed to a cleaner environment
Performance Fibers (Kaiping), one of Indorama Ventures’s facilities in Guangdong Province,China, implemented a pilot heat-recovery project for one of its dipping lines, achieving a reduction in natural gas consumption by 25% during the two consecutive months of the trial’s operations. Following this success, the site plans to expand the installation of the heat exchanger system for all four dipping lines. This innovative solution is the first of its kind in the tire cord fabrication industry. This expansion is expected to result in significant annual savings of approximately US$ 1.8 million and reduce 5,000 tCO2 of GHG emissions annually. Not only is this a remarkable financial and environmental success, it also promotes creativity and innovation among Indorama Ventures employees, and could be extended to other lines in the Fibers Mobility vertical.
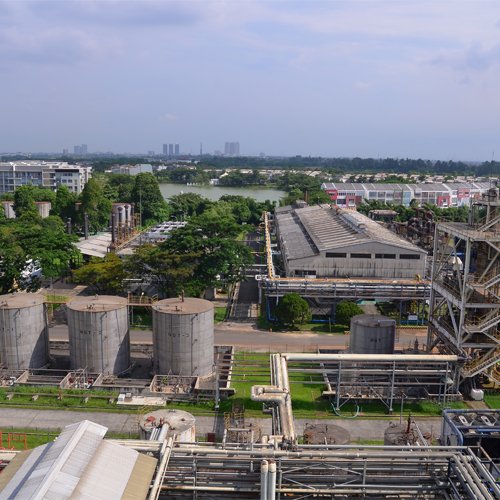
PT. Indorama Ventures (PTIVI) Indonesia commissioned two 7.5 MW gas turbines with two additional absorption chillers with 2,937 TR capacity from both waste heat and hot water recovery. This unit was installed along with two new HTM boilers using waste heat from turbines. This unique project, with heat recovery at three different stages, is the first time at Indorama Ventures that the cogeneration plant process will run using waste heat from turbine exhaust. This project, with a total investment value of US$28 million, will achieve an annual GHG reduction of approximately 30,000 tons. The expected CO2 savings will be roughly 25% for the whole site.
In order to reduce the emissions in the production of ethylene oxide, part of the gases produced are sold and used as raw materials in other production processes. In 2022, from April through December, Camaçari has sold 29,580 tons of CO2 , Maua in that same period has sold 4,393 tons of CO2 . The Botany unit, from legacy IOD has historically sold part of its CO2 produced by the Ethylene Oxide (EO) reaction, in 2022 the quantity sold was 4,229, corresponding to about 43% of the CO2 produced. Port Neches our biggest EO production unit is now developing a project to capture the CO2 produced, the destination is still under discussion, but there are discussions with beverage companies and with companies that can convert this CO2 into new chemicals.
